Van Westendorp Pricing: Four Questions, Then the Cost
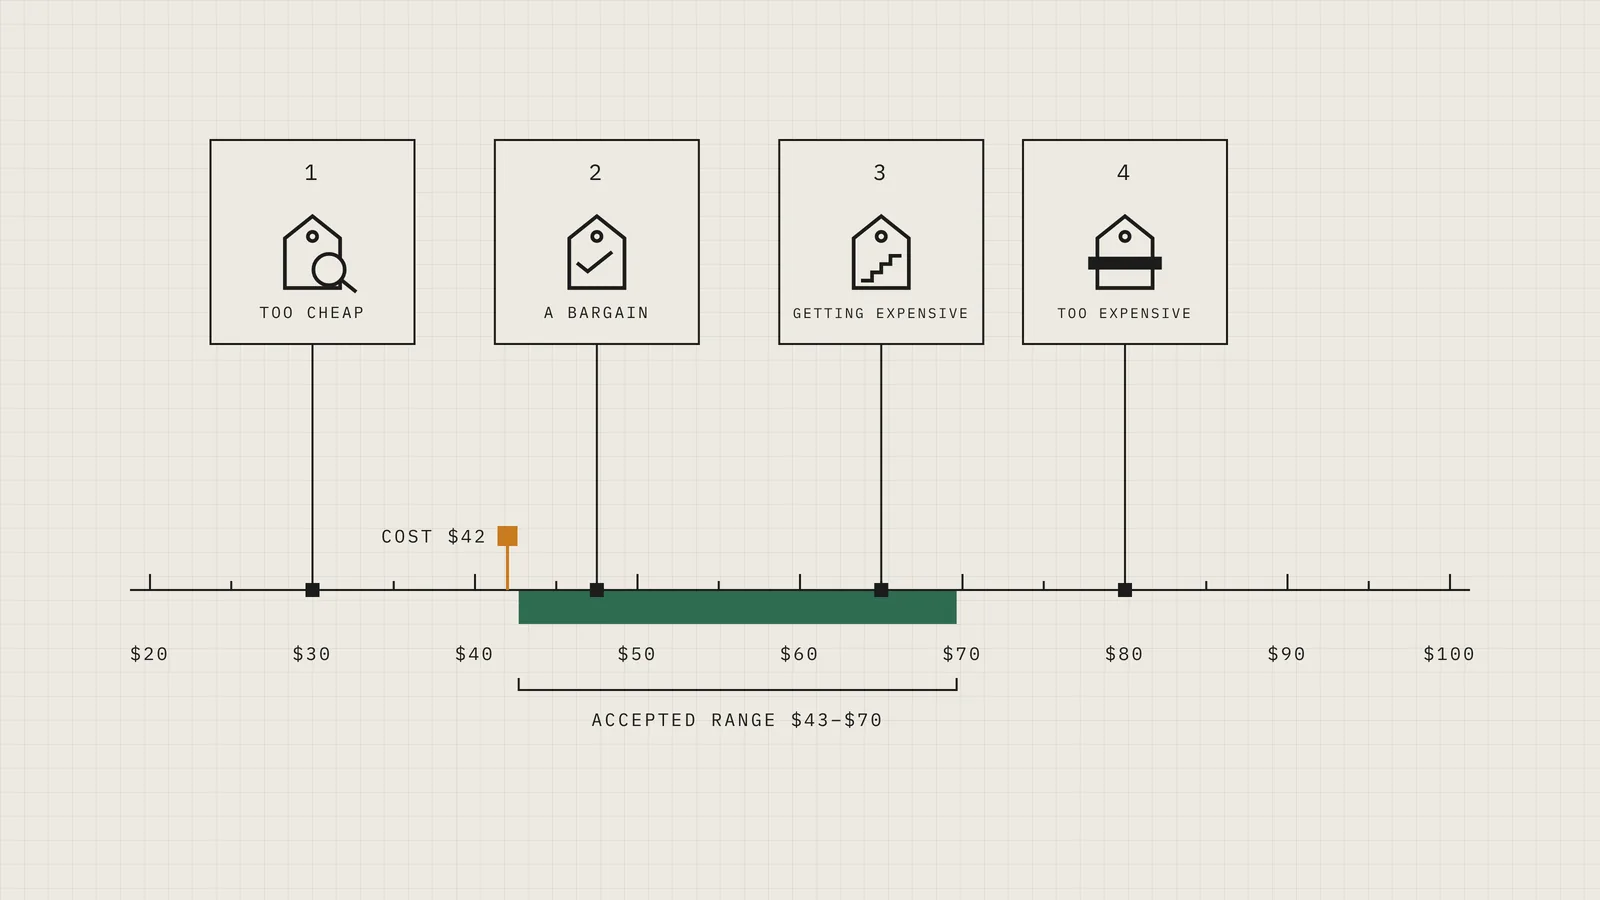
The Van Westendorp Price Sensitivity Meter finds the range of prices customers will accept for a new product or service by asking each of them four questions: at what price it would be so cheap they would doubt it, a bargain, getting expensive, and too expensive to consider. Plot the answers as four curves and their crossings give the lowest and highest acceptable prices and the price the fewest people rule out. What it cannot tell you is whether any of those prices pays for the thing, which is why the last step is to set them against what it costs to deliver.
This post is for anyone putting a price on something new: a founder with a first device, a manufacturer adding a product line, a firm turning a one-off job into a service with a menu price. It walks through the four questions, a worked example, how to read the crossings, where the method misleads, and the cost check that most write-ups leave out.
Why ask four questions instead of one
Asking customers "what would you pay?" gets a number they make up on the spot, usually low, because nobody wants to talk a seller up. The Dutch economist Peter van Westendorp's idea, published in 1976, was to ask about the edges instead. People are poor at naming the right price for something, and much better at saying when a price would make them suspicious and when it would make them walk away.
The four questions, asked in this order about one specific thing, described the same way to everyone:
- At what price would it be so cheap that you would doubt its quality?
- At what price would it be a bargain, a great buy for the money?
- At what price would it start to seem expensive, though you would still consider it?
- At what price would it be so expensive that you would not consider it?
Each person gives four prices that rise from the first to the fourth. Someone who answers out of order, a bargain dearer than too expensive, has misread a question, and the analysis leaves them out.
From answers to four curves
For every price, count the share of people whose answer puts that price on each side of their line:
- Too cheap: the share whose "too cheap" price is at or above it. It starts at everyone and falls as the price rises.
- A bargain: the share whose "bargain" price is at or above it. It falls too, later.
- Getting expensive: the share whose "expensive" price is at or below it. It rises from nobody.
- Too expensive: the share whose "too expensive" price is at or below it. It rises too, later.
Two curves fall and two rise, so they cross, and the crossings are the result.
A worked example
Here is a made-up example. A small maker has designed a Wi-Fi temperature logger for walk-in coolers, the kind a restaurant uses to prove its fridge stayed cold overnight. Before it commits to a production run, it asks forty restaurant owners the four questions.
Four curves, four prices
Example: a Wi-Fi temperature logger for walk-in coolers, priced by 40 restaurant owners, made up for this post.
The curves as a table
| Price | Too cheap | A bargain | Getting expensive | Too expensive |
|---|---|---|---|---|
| $20 | 100% | 100% | 0% | 0% |
| $25 | 95% | 100% | 0% | 0% |
| $30 | 80% | 100% | 0% | 0% |
| $35 | 48% | 100% | 0% | 0% |
| $40 | 23% | 95% | 0% | 0% |
| $45 | 5% | 80% | 0% | 0% |
| $50 | 0% | 50% | 0% | 0% |
| $55 | 0% | 23% | 13% | 0% |
| $60 | 0% | 5% | 38% | 0% |
| $65 | 0% | 0% | 65% | 3% |
| $70 | 0% | 0% | 88% | 15% |
| $75 | 0% | 0% | 98% | 28% |
| $80 | 0% | 0% | 100% | 55% |
| $85 | 0% | 0% | 100% | 75% |
| $90 | 0% | 0% | 100% | 90% |
| $95 | 0% | 0% | 100% | 95% |
| $100 | 0% | 0% | 100% | 100% |
The four crossings:
- Lowest acceptable price, $43. Where "too cheap" meets the share who would not call it a bargain. Below it, more people doubt the logger than think it a good buy.
- Optimal price, $50. Where "too cheap" meets "too expensive". The fewest people rule the price out on either side.
- Indifference price, $56. Where "a bargain" meets "getting expensive". As many think it cheap as think it dear; often close to what a market is used to paying.
- Highest acceptable price, $70. Where "too expensive" meets the share who would not yet call it expensive. Above it, more people walk away than would still consider it.
So the range these owners accept runs from $43 to $70, and a launch price somewhere between $50 and $56 is defensible.
Where it misleads
The method is quick and cheap, and its limits are worth knowing before a price goes on a box.
- People say one price and pay another. These are stated answers, with no money changing hands. Treat the range as where to start testing, not as a forecast of sales.
- It needs enough answers. Under about thirty, each new answer moves the crossings. The forty in the example is a reasonable floor for a first look.
- It knows nothing about competitors. A customer comparing against a known alternative answers differently from one seeing the category for the first time. Describe the thing as they will meet it, including what it replaces.
- It cannot tell a premium product from a cheap one. The same four questions about a basic version and a better one give two ranges, and the gap between them is the useful part.
- It says nothing about cost. Every price in the range may lose money. That is the next step.
The cost check
Suppose the logger costs $42 to build and ship: the board, the sensor, the enclosure, the battery, assembly, testing and the box. At the optimal price of $50 it keeps $8 a unit, 16% of the price. At the top of the range, $70, it keeps $28, but more of the people asked walk away there.
That is a thin product. A small rise in a component's price, a distributor's cut or a launch discount and it loses money at the price customers like best. Raising the price does not fix it, because the customers have already said where they stop.
The useful question then turns from "what should we charge?" to "what does it cost, and why?". For a device, the answers are usually in the design: a processor bigger than the job needs, a custom enclosure where a stock one would do, a board that takes a person ten minutes to test because nobody built a test fixture, two sensors where one would do. Taking $10 out of the cost to build moves the logger from 16% to about 36% at the same $50 price, without a customer noticing anything but the price.
A service works the same way. If a monthly service costs $380 to deliver and customers accept $350 to $600 for it, the margin is in the hours behind each delivery: the scheduling, the reports, the follow-up calls. Work taken out of delivery, by better tools or automation, moves the whole range into profit.
Running it yourself
You can run the four questions with any form tool that takes four number fields, send it to customers or prospects, and paste the answers into our Price Range Finder, which draws the curves, finds the four prices and shows what each leaves after the cost you give it. It runs in your browser; nothing you paste is kept.
Ask about one thing at a time, describe it the same way to everyone, and ask again when the product changes. Then put a real offer at a real price in front of real customers: that is the only test the curves cannot stand in for.